Datasets for Machine Learning With R by Lantz

I recently read Machine Learning with R by Brett Lantz. This is a book that provides an introduction to machine learning using R. I really enjoyed the book and thought Lantz did an excellent job explaining the content as well as providing many good references and examples, which is what lead to my problem with the book. As far as I can tell, Packt Publishing does not make its datasets available online unless you buy the book and create a user account which can be a problem if you are checking the book out from the library or borrowing the book from a friend. All of these datasets are in the public domain but simply needed some cleaning up and recoding to match the format in the book so I went ahead and made a github repo to host them.

r

Analysis of Gas Efficiency by Brand

I have recorded every trip to the gas station so far in 2014 and finally got around to analyzing the first seven months. I currently drive a 2010 Honda Fit and bought only 87 grade gas for the duration of this study.

I was initially interested in how far can I travel per dollar, which can easily be calculated:

A first attempt yields the following table:

Brand meancost
7-11 (Citgo) 7.858
76 7.123
Arco 8.451
Chevron 8.704
Costco 9.593
Safeway 7.791
Shell 7.597

Far and away Costco and Chevron have the best mean cost, but they each have only one datapoint and the Costco was located in Marysville, WA while the Chevron was located in Sherwood, OR which means that both of these were largely composed of highway miles and therefore higher fuel efficiency. I initially tried to account for highway miles versus city miles but have not had much success so far.

I then looked at MPG by gas station:

Brand meanMPG
7-11 (Citgo) 29.07
76 26.96
Arco 29.88
Chevron 34.80
Costco 30.50

Finally, I plotted MPG against mean cost.

Since (for now) we are ignoring Costco and Chevron, it appears that Safeway is best for lowest cost with highest mean MPG. I wonder if the Safeway ultimate shopper guy is still around?

Data and code at this gist

Writing a Twitter Bot for Fun and Profit

One of my first thoughts when Twitter had its IPO was that the days of writing Twitter bots was over. My fear was that they would lock down their platform in order to more accurately sell ads.

Man, was I wrong.

The Twitter API is still as robust as ever and allows for creating Twitter bots. One of the current trends is to try to generate buzz around a product or idea by getting people to use a specific hashtag. This can often lead to slightly hilarious results, such as the Face of MLB. Basically, the fans “vote” for their favorite player to be the Face of MLB by using a certain hashtag. I cannot think of a better job for a twitter bot.

Setting up a bot or Twitter Application is easy, just go to Twitter Apps and login or create a new username and log in. Follow the steps and you can get an API key in a few minutes. Although note that in order to write tweets as a bot you have to choose Read + Write (instead of the default Write). I run my bot largely using the tweepy Python library which provides easy access to the Twitter API. Here is a gist of a bot I am running for the Face of MLB. Twitter does not allow the same tweet to be posted more than once from an account so I just add something like the current time:

I will admit this is kinda silly, but if I can’t use my programming skills to get someone like Eric Sogard elected the Face of MLB, then what’s the point of programming?

Foursquare Without a Smartphone

I don’t have a smartphone. Because of this, I am apparently missing out on sweet checkin badges that I could be displaying on a user profile on fourquare or somewhere similar. This, in addition to how amazed I am by the Feltron annual report does make slightly envious of people with abilities to easily track daily events. Instead of getting a smartphone, I opted for a much more low tech solution.

This is a picture of any bars, restaurants or events I went to in the month of January. I am also trying to record how often I work out and what kind of workout I am doing. Its been interesting thus far to try and observe trends and determine if I can gain any insight. I can definitely see why people are interested in using a device like a fitbit and or a smartphone for tracking. Until that day, I think I will just stick to using pen on a calendar.

Thoughts on Solving My First 100 Problems on Project Euler

Finally!

A few years ago I set a goal to solve 100 problems on Project Euler with python. My motivation was to learn as much about problem solving as I could and ultimately finish with Problem 96, a sudoku solver. My plan was to write about my progess in a blog. More than three years later, I finally finished that goal (although I quickly abandoned that blog after starting it). The problems definitely got harder and it took me a while to get motivated to work on them as well as to solve them. I did however come up with three major lessons learned in my first 100 problems:

1 - Narrow the search space By far the biggest lesson I learned was how to cut down on possible options before even starting to program. Since one of the rules of Project Euler is to solve each problem within a minute, brute force quickly gets thrown out the window. An example would be taking the square root of the upper bound to reduce the amount of searching of numbers above the square root. I learned to think more in depth about the problem and try to optimize the search window to be more effiecient.

2 - Have a toolbox and use it I quickly developed a set of functions that I imported frequently that included functions such as a prime number sieve, a function to check if a number was pandigital, and a function for getting all factors of a number. I found that the way the problems were structured meant that I was frequently coming back to issues or approaches I used on earlier problems and I did not want to have to rewrite functions i had previously used.

3 - Google and Stack Overflow are your friends I used both frequently, there are many other people who post their answers or even just the solutions. You can use these if you want, but I found I was able to learn about libraries such as itertools, differences between python’s range() vs. xrange() and many different types of search algorithms.

I would highly encourage you to try out a few problems on Project Euler, I had fun and learned way more python than I thought I would (even if it took me a few years longer than originally planned.)

Hard Rules

I have been thinking a lot about this blog post and in many ways I have to agree what the author is saying. The internet can be a distracting place and making rules for yourself can help you stay focused and help maintain your energy levels. Here are some of mine:

  • Check Sports Illustrated only twice a day - around 10:30 AM and 2:30 PM
  • No reddit at work
  • Hacker News once a day in the evening
  • LinkedIn at most once a week
  • Check and respond to personal email only from noon - 1 PM while at work
  • No computer after 11 PM

For me, each of these were challenging to implement and I had to use browser extensions such as Leechblock or StayFocusd. Now, with these hard rules in place I don’t have to debate whether I should go to a certain site or feel guilty while on that site. Instead, I can put that energy either into work or simply getting off the computer faster - both of which are well worth the initial challenges of hard rules.

Analysis of the Listserve Emails

The Listserve is an email lottery, you sign up and once a day someone gets a chance to send the entire list an email. My previous post covered how I fetched these emails, this post will discuss the actual statistics obtained from The Listserve emails.

To:

The Listserve website mentions the countries of subscribers but thats about it. As of today, there are currently 21,402 subscribers. I fetched all the archival data I could from Internet Archive and looked at enrollment over time which has stayed consistent around 20,000. I also plotted enrollment over time.

From:

The Listserve allows you to use any name you want as the sender of the email, here are the ones that occurred more than once:

Name Occurrence
Anonymous 12
Laura 3
The Listserve 2
Ben 2
Beth 2
David 2
Sam 2
Michelle Huang 2
T. 2

Interesting that Michelle Huang had two entries, what happens if we look at first name only?

Name Occurrence
Anonymous 12
Chris 8
David 7
Jordan 4
Michelle 4
Alex 3
Andy 3
Ben 3
Brian 3
Daniel 3
James 3
Laura 3

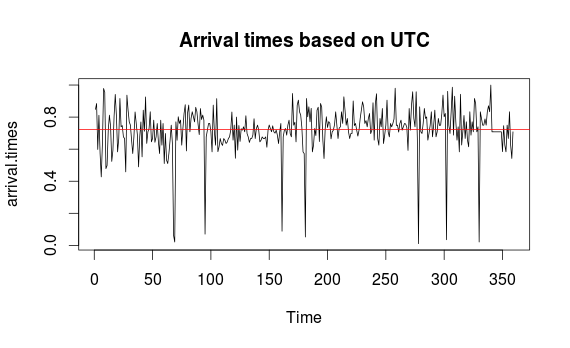
What about time of day sent?

I took all the timestamps from the emails and plotted when they were sent based on GMT. This was more due to personal curiosity but interesting nonetheless. The red line in the plot is the mean time which ended up being 17:19:15 GMT. Those large drops are likely due to some nuances in email dates. For example, I got two emails on 23 June 2012 and none on 22 June.

Subject:

I took all the subject lines and created a word frequency table on how often that word occurred:

Word Occurrence
life 9
world 9
day 8
little 8
love 7
story 7
advice 6
time 6

Body:

For the body of the email I created a Term-Document Matrix which is a matrix that describes the frequency of words and how often they occur together. This allows themes and trends of the body of work or corpus, which in this case happens to be The Listserve emails. I took all the emails and removed punctuation and stop words such as “and” or “but” and made a matrix based on how often the most common words occured together. I then created a dendrogram of all the words and how they clustered with each other.

The majority of the words are pretty evenly clustered and its difficult to determine any trends. However there is a cluster on the far left side of the tree which I zoomed in on:

This cluster includes word pairs such as “email” and “listserve”, “love” and “time”, and “life” and “people”. While its not surprising to see these words occurring so often together, it is interesting to see that a majority of people use this email to dispense wisdom or advice to the masses.

I have not yet been selected for The Listserve but I am sure these findings here will strongly influence what I write. In the meantime, I want to learn more about text processing since I found it pretty interesting.

Text Mining the Listserve Emails

The Listserve is an email list where people sign up for a chance to send an email out to the entire list to discuss whatever they want. Currently the number of people enrolled is about 20,000 and there has been one email per day since 16 April 2012. I thought that since this project has been running for about a year, it would be a nice opportunity to learn a little more about text mining.

In this first part I will discuss how I fetched all those emails and parsed them and in a second blog post I will talk about what I found.

The first issue was how to get the emails off the server and after trying a few solutions I finally ended up using the Python imaplib which is a Python library for connecting with an IMAP4 email server which is used by all the major providers such as Yahoo and Google. After connecting I used the Python email library which helped facilitate selecting certain parts of the email. I relied heavily on the function email.message_from_string() to fetch email attributes such as Message-ID or Sender. I took all these emails and dumped them into a SQLite database to later parse with R.

I use R almost daily for work so it was nice to tackle this part of the project with tools I knew pretty well. I used sapply() and strsplit() mostly to parse out parts of various email attributes and then used the tm package to handle all of the text processing. The tm package makes it easier to get all the emails into a term document matrix which is much easier to work with a large corpus of text such as this. I used an English dictonary with the tm package to remove stop words and for stemming (reducing the word to its base form). There have been two emails so far in Portuguese but the rest are all in English.

Initially I thought I could track all the emails by date but this proved to be a difficult task due to the nuances of email and when they actually got sent off the server. Instead I ended up using the Message-ID for making sure that I did not duplicate emails in the analysis.

I put up all the source code on a github repo.

r,, tm

Insert Cat Picture

My wife and sometimes other people ask me to send them research papers that are not publicly available which I am more than happy to do. However, why should I not have some fun with the final document I send her. I use the excellent, although sadly deprecated PyPdf. I have not checked out pyPdf2 but it does look promising. Here is the gist for how I randomly add an image (usually of a cat) to the pdf document and then rename it since most research sites name their documents similar to the DOI for the paper.

CSS Stopwatch

My wife kept complaining about being bored in long meetings so I decided to try and help her cut down on the monotony. There is a great demo for making a stopwatch with pure CSS. I extended it to provide two stopwatches that can run independently. My gist and the actual stopwatches. With more time I would go back in and add a javascript popup window to populate the names.