Visualizing the 2017-18 WA State Legislature
In his 2018 State of the State speech, Washington State Governor Jay Inslee made a passioned appeal for a carbon tax and proposed one in Washington State Senate bill 6203. Because of this, I paid more attention to the activities of the Washington State Legislature than I ever had before and I found it fascinating.
First off, lets start with the website for the state Legislature. Here is a screenshot of the Washington State Legislature page for SB 6203 which is the bill I was most interested in:
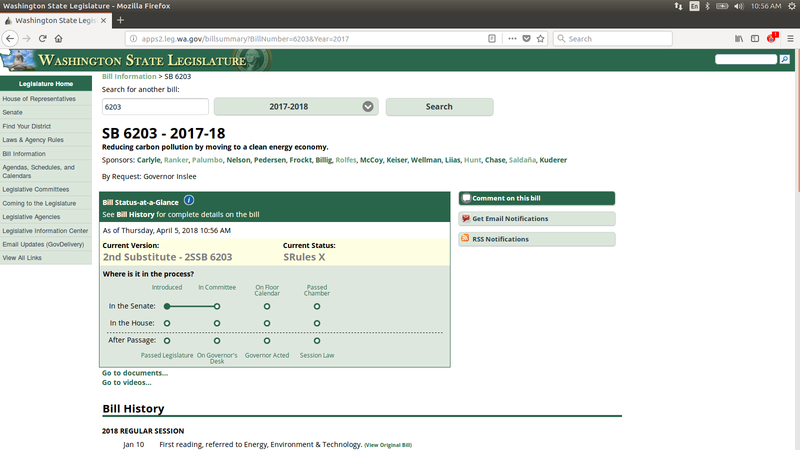
The website is very resource dense and well worth time exploring when the Legislature is in session. Every piece of proposed legislation shows the same amount of information and allows you to easily find and contact your legislators about a particular bill if interested. The site also has livestreams of committee hearings and displays vote counts on bills in almost real time as the votes are tallied on both the Senate and the House floor.
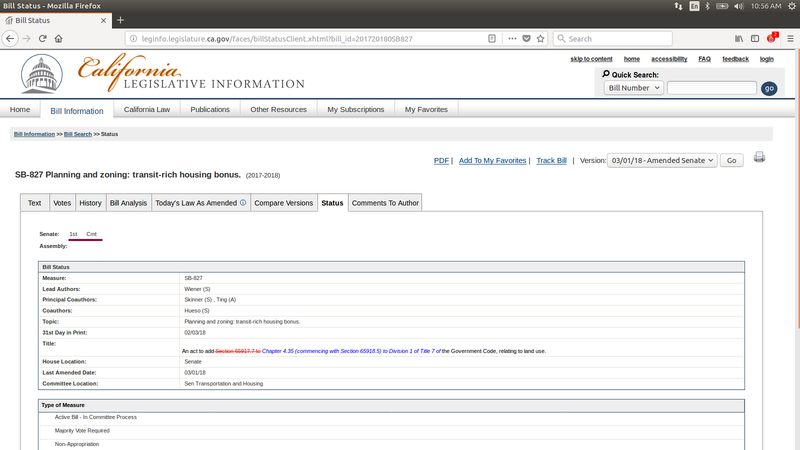
Is Washington State unique in this regard? Of course not, here is a screen shot for an interesting bill in Legislature for the State of California.
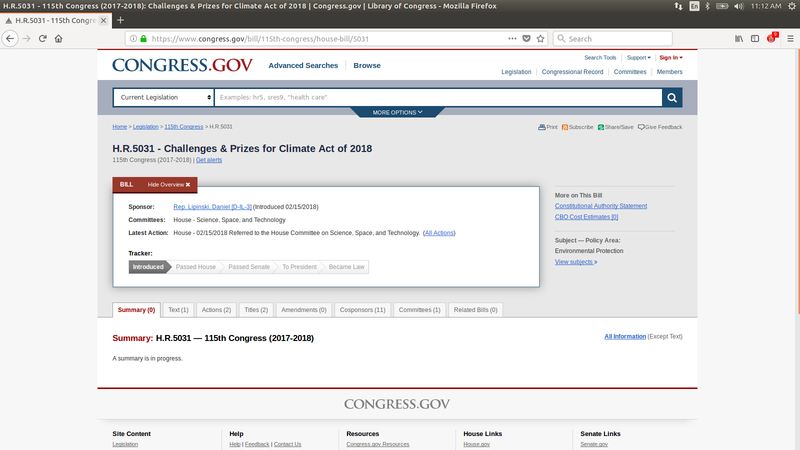
Finally here is a screenshot of a House bill on the United States Congress website
Does ease of use of the website increase participation in the civic process at the state level? That is a difficult question to answer but personally I am glad I get to use the Washington State one instead of the California State Legislature webpage.
The 2017-18 Washington State Legislative Session ended on March 8, 2018 and Governor Inslee then had 21 days to sign bills into law or veto them.
The conclusion of the 2017-18 Session made me wonder what happened to those bills that were introduced and how many of them actually became law. In addition to a great website, the Washington State Legislature also has an excellent set of Web Services that allow for programmatically capturing metrics and data about activities in the state legislation. One way to easily visualize this is with a Sankey Diagram (no relation to this Sankey though).
Here is a smaller image of the diagram with a larger version here
Code to generate this figure available on my GitHub repo