First Year on Fitbit
After a year on Fitbit, I figured it might be time to take a look at the data that I have been generating. Unfortunately, Fitbit makes you sign up for Premium which charges you $50 per year to export your data. Fortunately, Cory Nissen has created an excellent R package for doing just this. The package simply uses a POST request handled by Hadley’s httr library to generate a cookie and then parses the returned JSP results to return a nice data.frame.
Anyways, onto the data.
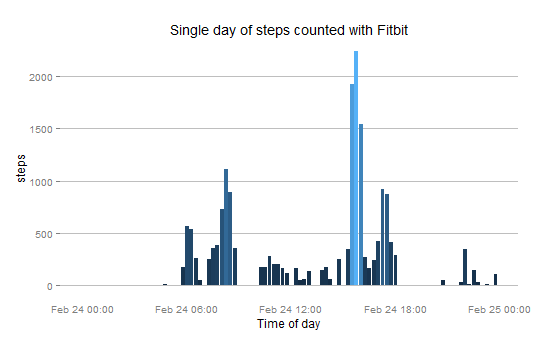
The first command I tried was the get_15_min_data() for parsing step
data in 15 minute increments. I figured that looking at yesterday’s data
would be granular enough to get a good feel for the data.
I then plotted number of steps taken per day, with a smoothing function overlaid:
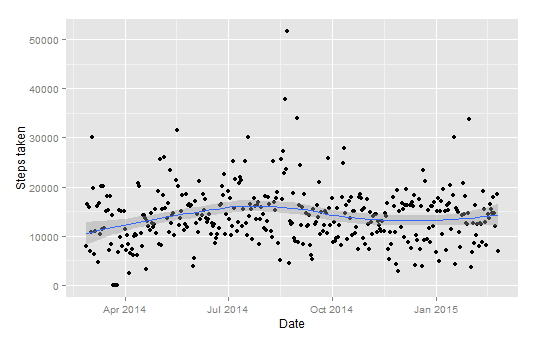
I had a mean step count of 13935 for the past year. This data is more interesting to look at as more of an overall trend. There definitely a seasonal trend in the summer which makes sense. I can also see the signatures of when I went on a four day backpacking trip in August and when I broke two ribs and was confined to the couch for four days in mid-March.
Since I have a Fitbit one, I can also measure floors climbed.
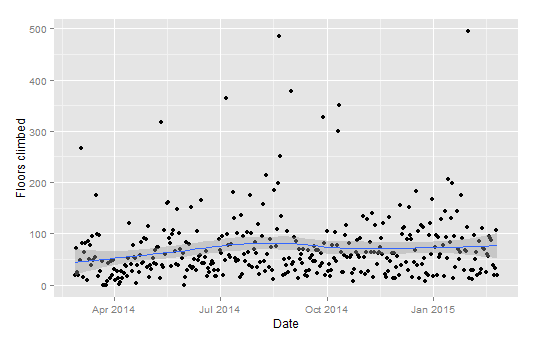
My mean number of floors climbed is 69.62 which seems absurdly high. My desk is on the fourth floor of my building and I usually take the stairs but not sure that is enough to fully explain why these counts are so high.
Still, it is pretty interesting to look at this data outside of the Fitbit interface and I would highly recommend checking out Cory’s github repo
Also, speaking of github, for those of you who regularly follow this blog (hi, Mom!) I have moved away from making a new gist every time to simply having a standalone repo