Cluster Analysis of World Flags
After spending time looking at world flags, I have started to notice similarities in flags from different countries. Sometimes the similarity may be due to historical relationships, such as the United States of America and Liberia or the United Kingdom and Australia. Other times it may be purely coincidental such as Romania and Chad.
 |
|---|
| Flag of Romania on left, Flag of Chad on right. Yes, really! |
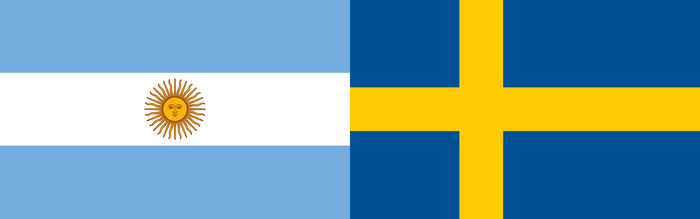
I was interested in determining if additional relationships between flags could be discovered via mathematical analysis of the properties of each flag. To begin my analysis, I needed to find a standardized set of flag image files to make up my dataset. I started by using flags from Wikipedia but found these were too variable in size and image quality. I later ended up purchasing a set of flag image files from CountryFlags. I used the Python library colorgram to scan every pixel of every flag image file and then determine each pixel’s color using the RGB color model. There are many distinct shades of every color so I grouped all shades into groups of red, yellow, blue, green, orange, white and black. For example, the blue of the Argentina flag is quite different from the blue of the Sweden flag, however for the purposes of this project I called them both blue.
 |
|---|
| Flag of Argentina on left, Flag of Sweden on right |
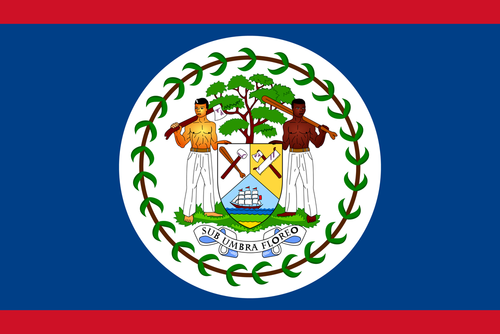
In addition to determining the colors of each flag I was also interested in what percentage of each flag was a specific color. By this method, the flag of France would be represented as 33% red, 33% white and 33% blue. Some country flags have smaller details with distinct colors which made classification trickier. To simplify analysis I limited my dataset to colors that appeared on at least 5% of the overall flag. For example, the flag of Belize has many small details that had to be omitted while retaining the dominant red, blue, and white color pattern.
 |
|---|
| Flag of Belize |
After collecting the data, I implemented a clustering algorithm, specifically K-means clustering which is a mathematical method for grouping observations into clusters. Each cluster contains individual observations with similar values and the smaller the cluster the more similar all of the values are in that particular cluster. For an initial demonstration, I clustered the eleven country flags of South America into three clusters.
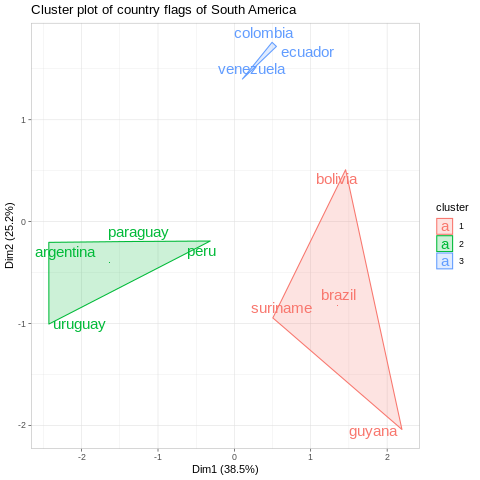
From this figure, three clusters of interest are distinctly observed with the smallest cluster consisting of the flags of Colombia, Ecuador, and Venezuela. We can see the other two clusters which have grouped the remaining flags of South America into two separate and larger clusters. From a historical perspective, this makes sense as most countries in South America were colonized by Spain or Brazil and became independent at approximately the same time.
For the analysis of all the flags of the world, I again set the number of clusters to 3 in order to simplify the visual output:
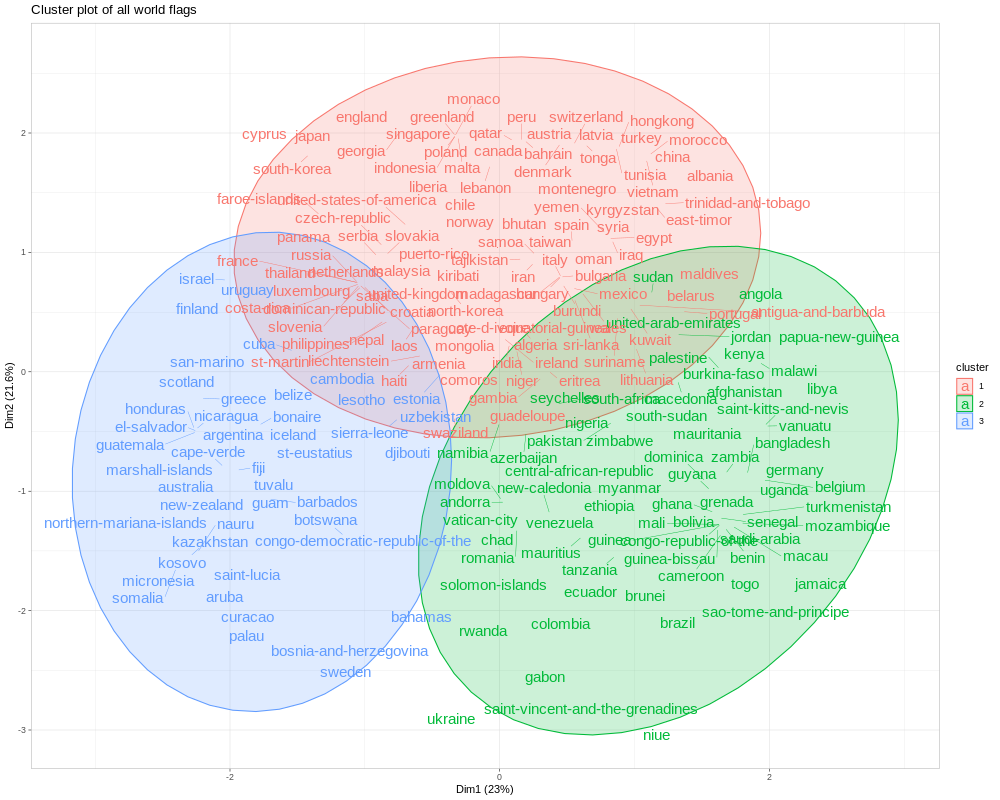
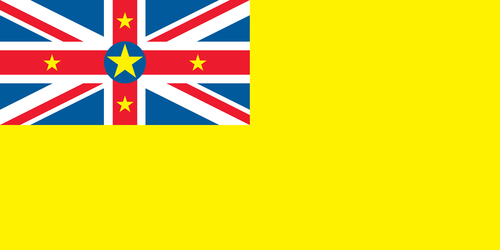
Unsurprisingly, there is quite a bit of overlap between the three clusters and it is difficult to ascertain how these clusters are distinct from each other. Most countries use good design patterns (For example the NAVA guide), similar colors, and similar color proportions for their flags. However, there are some interesting observations and unexpected pairings that reveal themselves after studying the figure. For example, Lesotho and Uzbekistan have similar design patterns as well as similar color profiles. Another interesting pairng that does not share similar design patterns is Honduras and Greece. Also interesting to note how similar many of these flags are, with the two notable outliers being Ukraine and Niue.
 |
|---|
| Flag of Niue |
Cluster analysis is by no means definitive and is typically performed as more of an exploratory analysis. Regardless, I found this method a rewarding way to reconsider the design patterns of the many flags of the world.
As always, analysis code can be found on GitHub