Changes in Voter Turnout Between the 2014 and 2018 US Elections
As I watched the livestream of the 2018 US midterm election results, I was absolutely stunned at the significant increase in voter turnout over the 2014 US midterm election. Now that almost all of the 2018 election results have been certified by their repective Secretaries of State, I wanted to take a look at how this increase in voter turnout manifested on a state by state basis.
To make things as simple as I could, I primarily used the data from two New York Times elections pages: the 2014 results page and the 2018 results page.
I realize this data may not be complete as some of the voter counts are not fully reported for all precincts on these pages. However, the total vote count from the 2014 data is 72,031,124 while the total vote count from 2018 is 106,385,810 which I felt was accurate enough for the purposes of this analysis.
In both elections, I primarily focused on the House of Representatives because that was the only office for universally up for election. As I embarked on this project I soon realized that a direct comparison would not be possible after Pennslyvania re-drew its congressional maps in early 2018 and Florida did so as well in a 2016 redistricting.
This first map simply shows congressional districts where the voter turnout increased. The congressional districts colored grey have either a decline in voter turnout, or where the candidate ran uncontested in either 2014 or 2018 (or both) and therefore do not have a difference in percentage to measure.
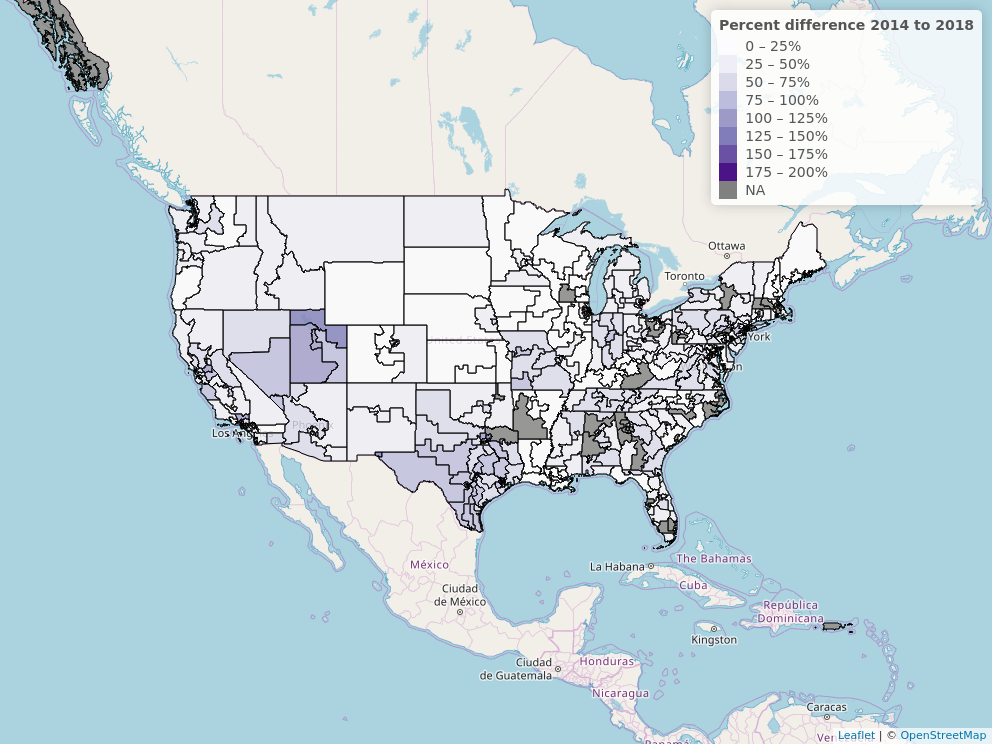
Explorable version here
The second choropleth map shows states that increased in voter turnout as blue, states that decreased in voter turnout as red while those colored grey had at least one uncontested election.
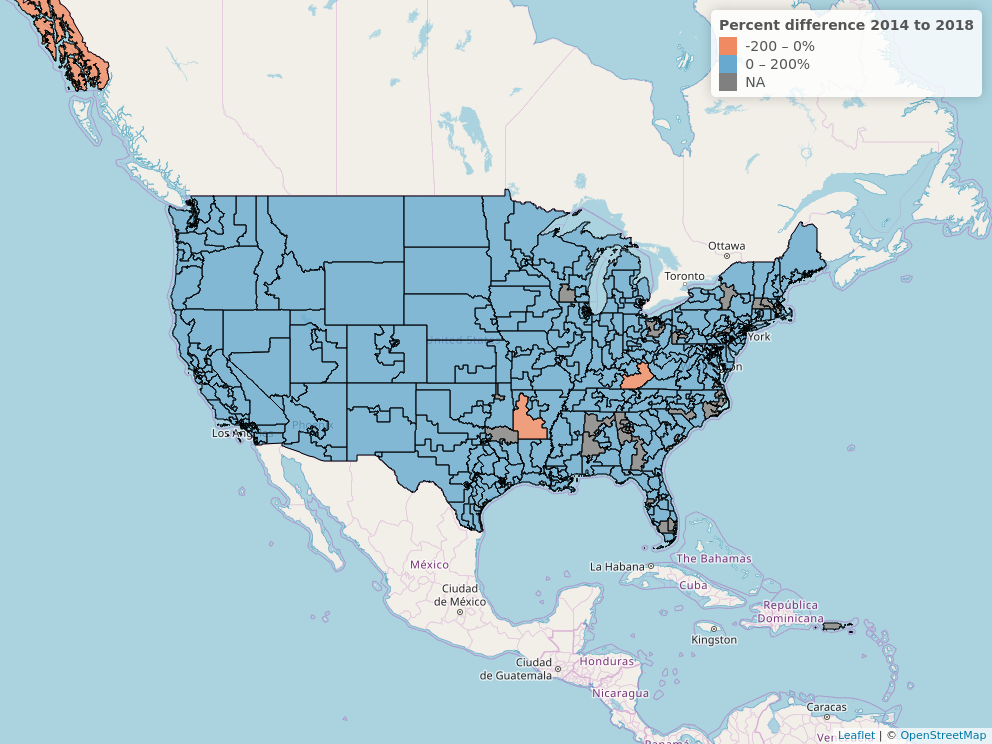 Explorable version of this map
here
Explorable version of this map
here
It is interesting to note that only seven US Congressional districts had decreases in voter turnout from 2014 to 2018. Table of districts with decreased voter turnout:
| District | 2014 votes | 2018 votes | Difference |
|---|---|---|---|
| IL-09 | 203946 | 91476 | -55.14 |
| CO-01 | 266021 | 256542 | -3.56 |
| PA-02 | 202635 | 197495 | -2.53 |
| AK-00 | 242844 | 238131 | -1.94 |
| IL-07 | 171502 | 170290 | -0.70 |
| AR-04 | 205066 | 204113 | -0.46 |
| KY-05 | 218697 | 218324 | -0.17 |
The district with the highest increase in turnout? That would be CA-34
Finally I grouped all the votes together by state to make the following choropleth of US House votes on a state level:
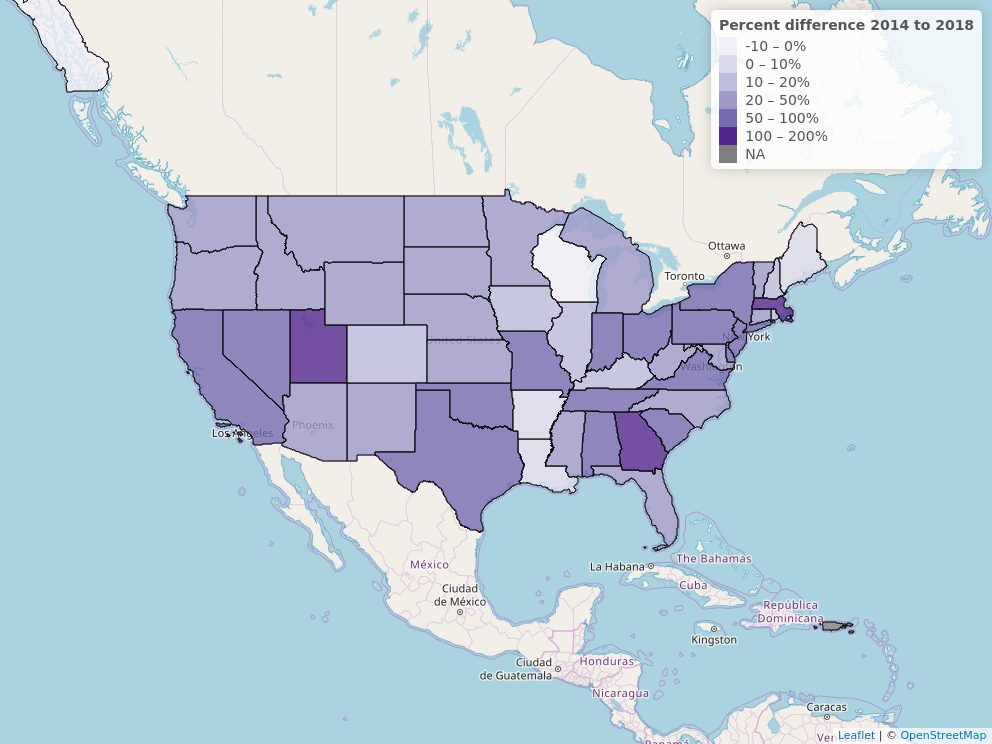 Explorable version of this map
here
Explorable version of this map
here